

- Families in the Home Counties and outer London can expect to pay £58,864 a year for a full-time, live-out nanny working 50 hours a week, an increase of 27% or £12,428 on the previous year.
- For the first time, this is higher than the rates commanded by inner London nannies, who’ve also seen annual wage growth (+11%) and now earn, on average, £56,238.
- In another first, average hourly rates for nannies are now more than £20 per hour in both inner London (£21.63) and the Home Counties and outer London (£22.64).
- In the past year, Nannytax has seen a 22% increase in parents enquiring about employing nannies.
It’s now more expensive to hire a nanny in the Home Counties and outer London than in inner London, as demand grows for flexible childcare from families migrating further out of the capital. That’s according to nanny wage figures for the tax year 25/26 published by Nannytax, the nanny payroll provider and employment experts.
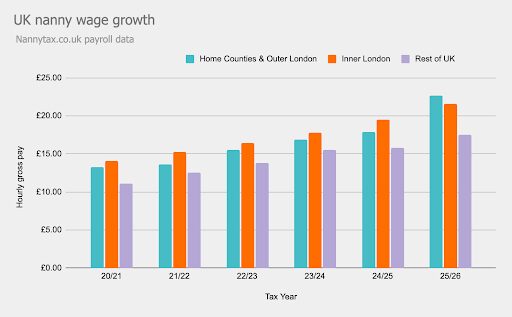
Based on the average hourly gross rate of £22.64, full-time nannies in the Home Counties and outer London are now earning close to £60K per year (£58,864) which is £12,428 more (+27%) than the previous tax year. Out of the six Home Counties, nannies in Surrey (£23.54) and Hertfordshire (£23.04) are being paid the highest rates. In outer London the hourly rate is £21.73.
For the first time, inner London nannies are also commanding an hourly rate of more than £20 per hour (£21.63), making their annual full-time earnings £56,238, a year-on-year rise of £5.5K (+11%).
Across the rest of the UK, the gross hourly rate for a nanny is now £17.56, equating to a full-time annual salary of £45,656, up 11% on the previous year. This is 58% higher than five years ago, meaning UK nanny wage growth has outpaced inner London (+53%) over the same period.
Although nannies earning above £80k represent just 1% of nannies on payroll, this top-earning cohort has increased as a percentage of the total by around a third (34%) in the past year.
The chart below shows nanny wage growth over the past five years:
The table below shows average gross live-out nanny wages for the tax year 2025/26:
| Annual gross wage | YOY % change | Annual pay increase | 5-year % change* | |
| Home Counties & Outer London | £58,864 | 26.8% | £12,428 | 70.7% |
| Inner London | £56,238 | 10.9% | £5,512 | 53.2% |
| Rest of UK | £45,656 | 11.4% | £4,654 | 58.2% |
*Comparing 20/21 tax year
Kirsty Wild, nanny employment expert at payroll provider Nannytax, says: “Such a sharp spike points to an increase in affluent parents competing for a limited pool of experienced nannies in the Home Counties and outer London. Able and willing to pay significantly above market rates to secure the best nanny for the job, they are adjusting expectations for everyone.
“The Home Counties are increasingly popular with London leavers*, and even a relatively modest rise in families migrating a bit further out, with a combined income of above £200K, plus demanding careers and longer commutes, could have a significant effect on the nanny market. Throw in a shortage of experienced nannies and it’s a recipe for wages to skyrocket.
“However, we do speak to parents of multiple young children who find employing a nanny is still more cost effective for them than nursery fees.
“When it comes to complying with the rules, parents can’t afford to get this wrong. Many don’t realise most nannies are not self-employed. When hiring a nanny, they are taking on the responsibilities of an employer, and that means ensuring the correct tax, payroll and employment obligations are met from day one.”
Frankie Gray, director of nanny agency franchise Harmony at Home, comments: “A lot of things are happening at once. Families are leaving London in search of bigger homes and green space, but they’re still tied to the capital for work. The ‘one-hour commuter belt’ around London is now our busiest market and we’re seeing especially high demand for nannies in Canterbury, Kent. In these areas the pool of quality candidates is small – and smaller still if you’re looking for a very experienced, highly qualified nanny.
“Also putting upward pressure on wages is the cost of living. Everything has gone up and nannies are asking for more to account for it. Where supply is low and demand strong, they’ll secure those higher wages very easily.
“We’ve also seen a big increase in older nannies returning to the market after career breaks to raise their own children. A lot of these nannies are in their late 40s and 50s, are Norland-trained or have the excellent NNEB childcare qualification, and are commanding higher salaries to reflect all that knowledge and training.”
*Hamptons reports that, in 2025, 18.2% of homes sold in the Home Counties were bought by a Londoner, the highest share since 2017 (source)
Source data hosted here: https://www.nannytax.co.uk/nanny-salary-index
Methodology: Data for the tax year 25/26 based on Nannytax payroll records. Average (mean) gross wages for a live-out nanny on typical full-time hours (50 hrs per week).
Brighton-based Nannytax is the largest and longest-running nanny payroll provider in the country, trusted by tens of thousands of domestic employers for the past 30 years. Its services span nanny payroll, HR, pensions, employers’ liability insurance, nanny insurance and benefits. www.nannytax.co.uk